IQ Metrics Dashboard
Your Data. Your Way. Effortlessly Track What Matters Most.
The Metrics Dashboard puts the power of data visualization in your hands. Fully customizable and designed for your library’s unique needs, the Metrics Dashboard saves you time and makes it easy to monitor your key metrics - all in one place.
How It Works
Capture Your Metrics
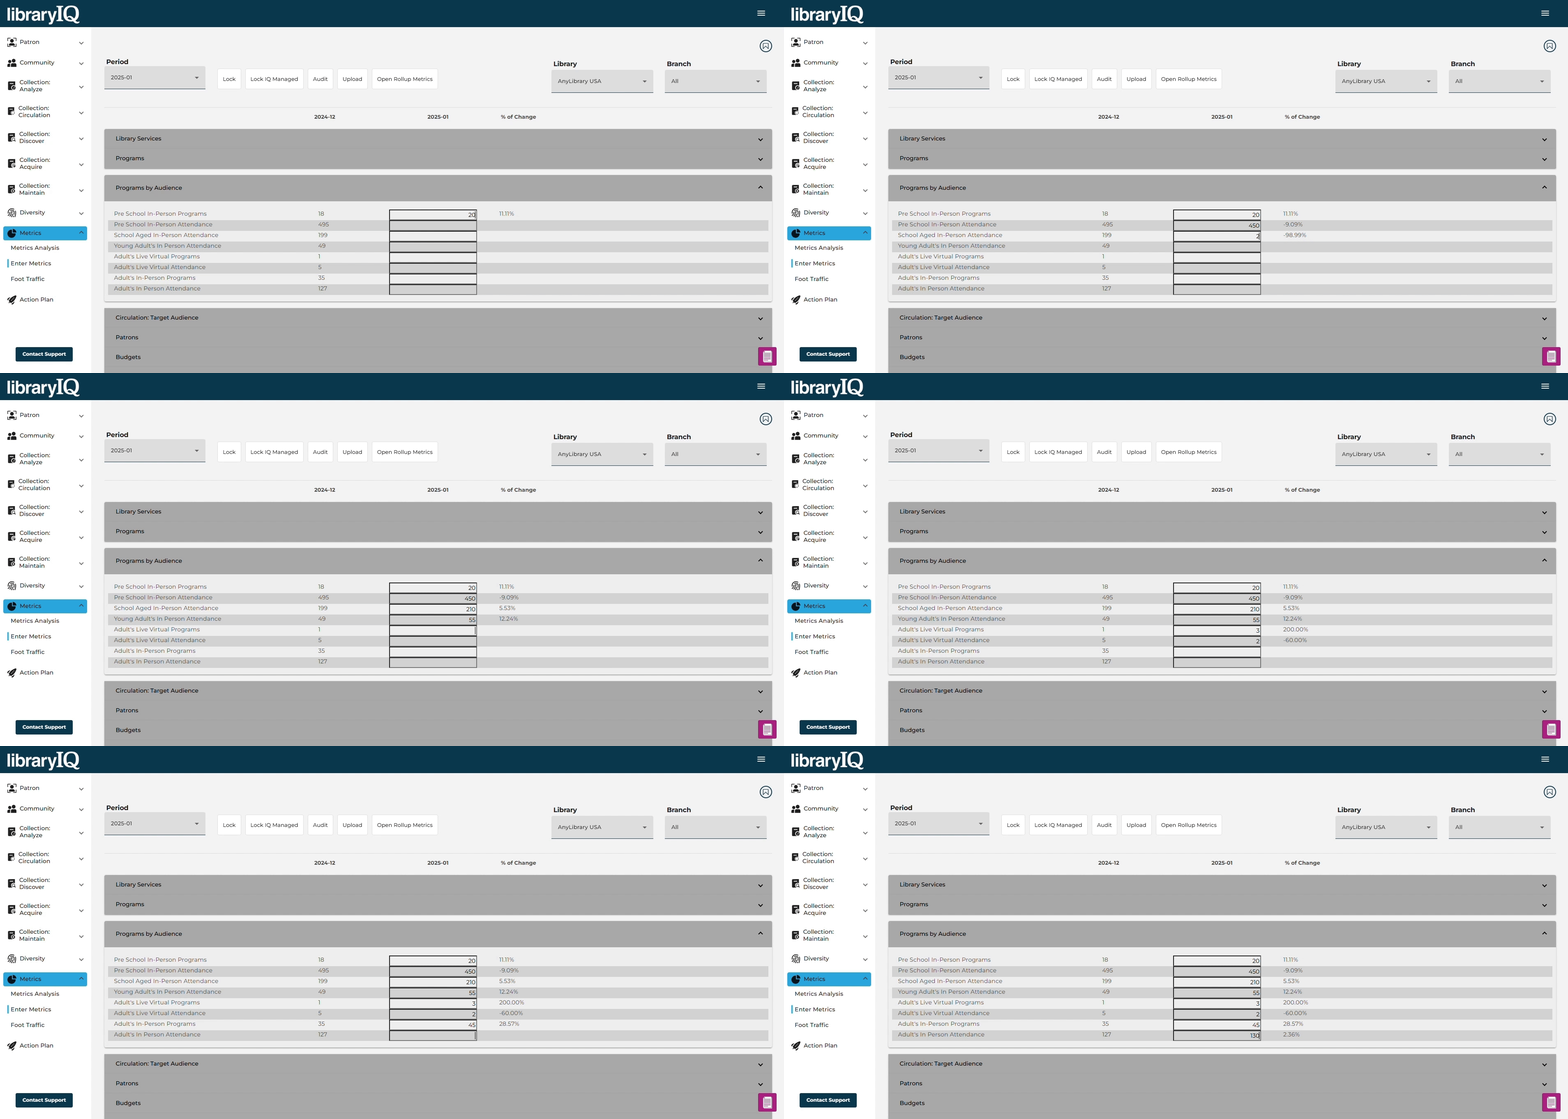
Your library’s performance data is captured through Enter Metrics, eliminating spreadsheets and manual tracking. User permissions allow for staff collaboration and ensure data security.
Build Your Custom Dashboard
With just a few clicks, the Metrics Dashboard transforms your data into actionable insights.
- Choose the Metrics That Matter: Select the metrics that are most important to your library, from program attendance and visits to eMaterials circ and computer usage
- Visualize Your Impact: Transform your data into custom tables and charts that highlight trends and patterns over time
- Monitor Progress at a Glance: Whether you’re preparing a monthly update or comparing year-over-year data, the Metrics Dashboard makes it easy to track performance
Why You'll Love It
SAVE TIME
Say goodbye to complex manual reports by letting the dashboard do the heavy lifting.
CUSTOMIZABLE
Tailor your dashboard to your library’s goals—no one-size-fits-all approach here.
VISUAL INSIGHTS
Spot trends, track progress, and share updates with stakeholders easily.


